Search for real estate by price, bedroom, or property type. View all the latest MLS® listings.
Currently no listings match your search.
Please modify your search criteria.
Market Overview
The current real estate landscape in Surrey offers strong opportunities for buyers searching properties for sale. With 3,943 active listings, the market provides a meaningful selection across different layouts, styles, and budgets—helpful for both first-time buyers and experienced movers looking to compare options. The average listing price sits at $1,331,325, offering a clear benchmark for understanding what today’s inventory looks like.
Timing is also an important factor. Properties are averaging 77 days on the market, which can signal how quickly well-priced homes are moving and how much leverage buyers may have during negotiations. The latest -43.1% helps frame market direction, whether values are trending upward, stabilizing, or adjusting. Together, these indicators create a practical snapshot of what to expect when exploring properties for sale in Surrey—from overall competitiveness to the depth of choice available right now.
Browse Listings
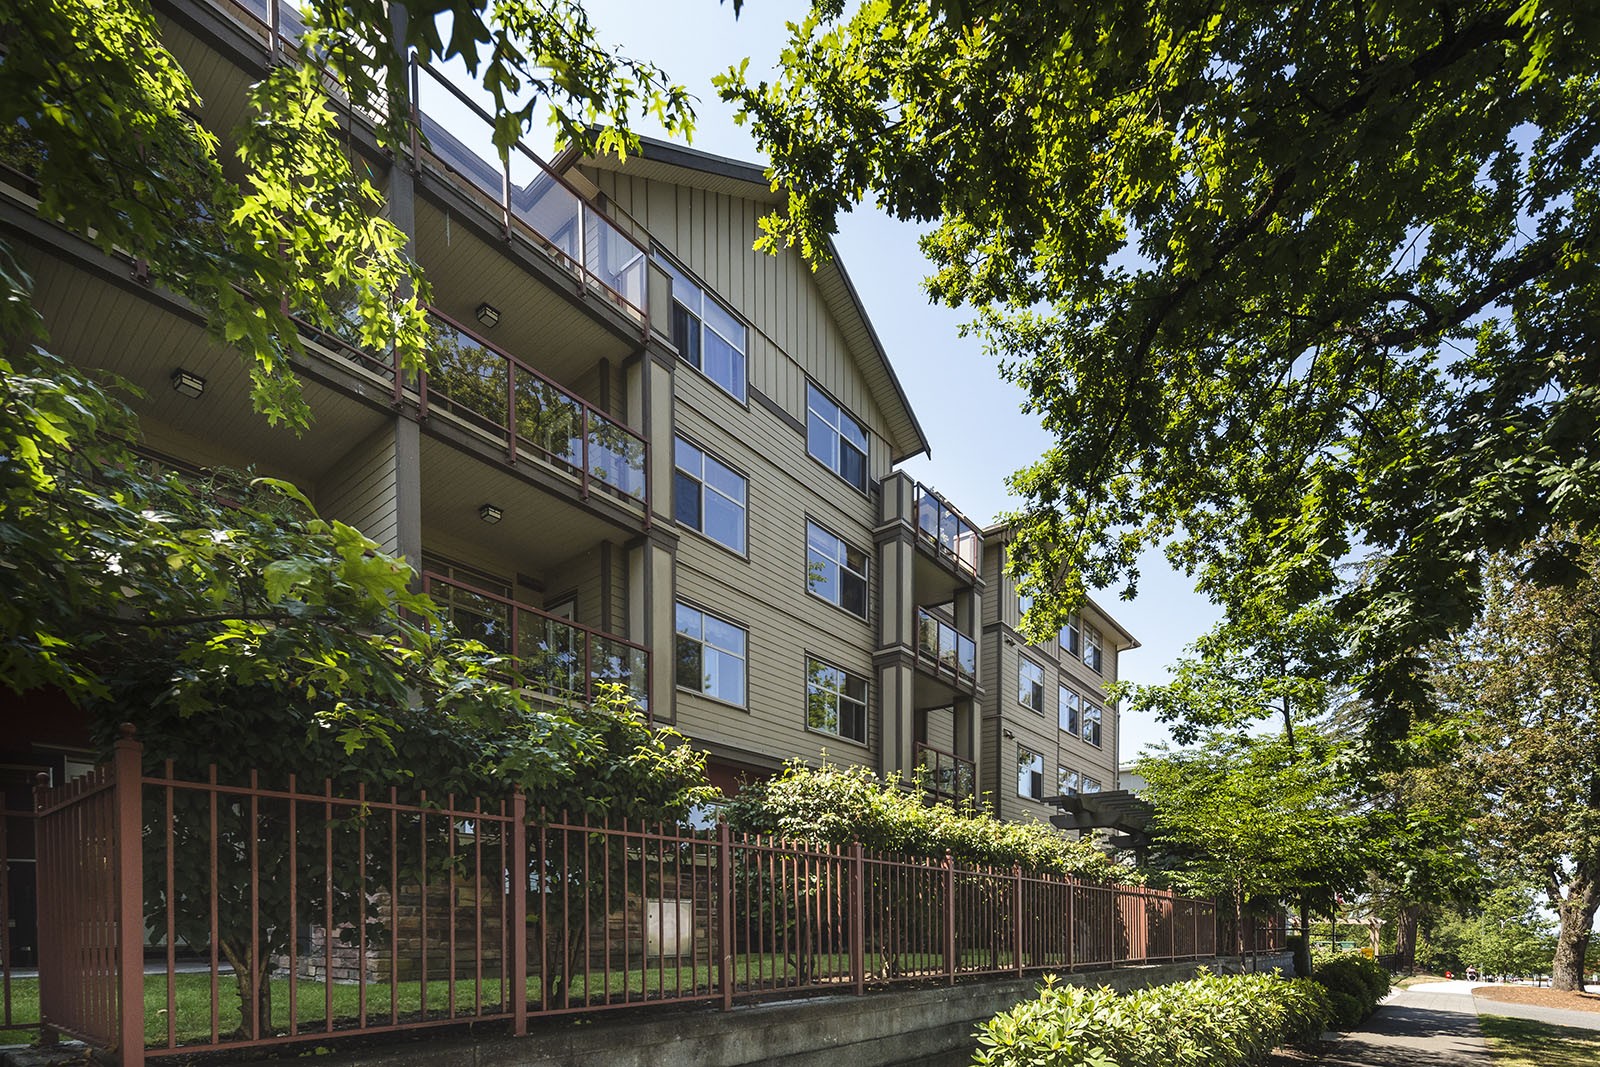
Visitors can browse 3,943 available properties for sale in Surrey and quickly compare what’s currently for sale. Inventory often spans a range of sizes, finishes, and settings—supporting different goals such as finding a low-maintenance home, prioritizing extra space, or targeting a particular lifestyle.
What makes this area appealing is the ability to balance day-to-day convenience with a strong sense of neighbourhood identity. Many buyers focus on how a property fits their routine—commute patterns, walkability, and the overall feel of the streets—while also weighing longer-term value and flexibility. Exploring active listings is the best way to understand what features are common in the area and which listings stand out for price, condition, and location.
Pricing Insights
Pricing for properties for sale in Surrey is best understood through a mix of benchmarks and ranges. The average price is $1,331,325, which provides a useful reference point when comparing individual listings. For a more apples-to-apples view across different floorplans and styles, the average price per square foot is $622—a metric many buyers use to evaluate value relative to size, upgrades, and overall condition.
Because list price does not always reflect final sale outcomes, it’s helpful to look at both the property’s features and how it is positioned relative to similar listings. Buyers can narrow their search by budget and must-have criteria, then use price per square foot, days on market, and recent activity to identify which homes appear competitively priced. The breakdown below provides an at-a-glance view of pricing by bedroom type.
Average Prices by Bedroom
Bedrooms Avg. Price Listings 1 Bed $514,344 419 2 Beds $740,016 859 3 Beds $1,287,916 1,085 4 Beds $1,639,553 682 5+ Beds $2,167,492 861 Living in the Area
Life in Surrey is often defined by a balance of comfort, convenience, and community atmosphere. The area’s overall character tends to appeal to people who want a neighbourhood that feels established and livable, with day-to-day essentials generally within reasonable reach. Depending on the specific pocket, residents may prioritize walkability, a quieter residential setting, or easy access to main routes that connect to surrounding parts of the region.
The community feel can be an important part of the draw. Many buyers look for places where the streetscape feels welcoming and where the neighbourhood supports a predictable routine—whether that means commuting, running errands, or spending time outdoors. A range of housing types can also make the area attractive to different households, from solo buyers and couples to growing families and downsizers seeking a simpler lifestyle.
From a real estate perspective, buyers often evaluate how well a property fits both present needs and future plans. Layout flexibility, storage, natural light, and overall maintenance expectations are frequent considerations, especially when comparing multiple listings. Exploring properties here is also about matching priorities—space versus location, turnkey finishes versus renovation potential, or short-term convenience versus long-term flexibility. Reviewing listings alongside neighbourhood impressions can help buyers confidently choose a home that aligns with lifestyle as well as budget.
Market Trends
To understand how the market is moving, it helps to compare key indicators over time and across listing segments. The table below highlights trend data for properties for sale in Surrey.
Market Trends
Period Avg. Price Listings Avg. DOM Current $1,331,325 3,943 77 days Last 12 Months $1,065,867 6,002 32 days Last 90 Days $987,145 1,013 49 days Top Areas
Surrey can include multiple pockets with their own feel, pricing patterns, and property mix. Reviewing top sub-areas is a practical way to focus the search and compare what’s available in each part of the community.
Top Areas
Area Avg. Price Listings Avg. DOM South Surrey $1,834,454 994 69 days Newton $1,193,905 879 86 days Whalley/City Centre $916,855 847 87 days Guildford/Fleetwood $1,184,598 685 77 days Cloverdale/Port Kells $1,465,611 538 64 days Frequently Asked Questions
What is the average price of properties for sale in Surrey?
The average listing price for properties for sale in Surrey is $1,331,325. This figure is a helpful starting point for budgeting, but individual listing prices can vary based on size, condition, layout, and where the property sits within the broader area.
How many properties for sale are currently available in Surrey?
There are currently 3,943 active listings that match properties for sale in Surrey. Inventory levels can influence negotiating conditions—more choice can provide flexibility, while fewer options may mean acting quickly when the right home appears.
How long do properties typically take to sell in Surrey?
On average, listings are spending 77 days on the market in Surrey. Days on market can vary by price point, property condition, and how accurately the home is priced compared to similar listings. Buyers often use this benchmark to gauge how quickly they may need to book showings and submit an offer. Buyers can narrow the search by identifying a comfortable monthly payment range, then comparing homes using key indicators such as $1,331,325, $622, and typical market speed (77 days) to understand which listings represent strong value.
Want to dine out? There are plenty of good restaurant choices not too far.Grab your morning coffee at Tim Hortons located at 15255 10 Hwy. Groceries can be found at Vegetarian Delight Bakery which is a short distance away and you'll find Heart to Heart Care a short walk as well. For nearby green space, Kettle Crescent Park and Sullivan Elementary School Park could be good to get out of your home and catch some fresh air or to take your dog for a walk.
If you are looking for transit, don't fear, there is a Bus Stop (Northbound 152 St @ 58A Ave) a 3-minute walk.