Search for real estate by price, bedroom, or property type. View all the latest MLS® listings.


1) Market Overview
The North Vancouver City rental market for houses for rent offers a clear snapshot of current availability and pricing for people comparing options across the region. Right now, there are 28 active listings, giving renters a meaningful selection to evaluate by budget, layout, and lifestyle needs. The average listing price sits at $3,995, providing a helpful benchmark for what is most commonly available in today’s market, while the typical time on market is 62 days, which can indicate how quickly well-positioned rentals are being secured.
Recent movement in pricing is reflected in -31.1%, a useful signal for understanding whether the market is becoming more competitive or easing slightly. When paired with days on market, this trend helps renters decide how quickly to act, what trade-offs to consider, and where flexibility may unlock better value. Overall, North Vancouver City remains a market where informed timing and clear priorities can make a real difference when evaluating houses for rent.
2) Browse Listings
Visitors can explore 28 available houses for rent in North Vancouver City to compare homes by size, number of bedrooms, and overall fit. Listings often range from practical, low-maintenance options to larger properties designed for more space and privacy, making it possible to narrow down choices based on lifestyle rather than just price alone.
This area appeals to renters looking for a balanced day-to-day routine—whether the priority is a quieter residential feel, easier access to everyday services, or simply having multiple neighbourhood pockets to choose from. Browsing for rent is also a smart way to spot patterns in pricing and availability over time, especially for renters who want to act quickly when the right home appears.
3) Pricing Insights
Pricing for houses for rent in North Vancouver City is best understood by looking at several measures together. Comparing listings using the average price per square foot ($4) can also help clarify value, particularly when two homes have similar rent but different layouts, lot characteristics, or overall condition.
For renters weighing different property sizes or household needs, the average square footage (905 sqft) adds another practical lens. A lower price doesn’t always mean better value if the usable space, storage, or functionality is limited; likewise, paying more can make sense when the layout supports work-from-home needs, multi-generational living, or long-term comfort. Reviewing the distribution of pricing by bedroom count is often the quickest way to shortlist realistic options without overextending the budget.
Average Prices by Bedroom
Bedrooms Avg. Price Listings 1 Bed $2,783 5 2 Beds $4,060 20 3 Beds $5,125 2 4 Beds $6,500 1 4) Living in the Area
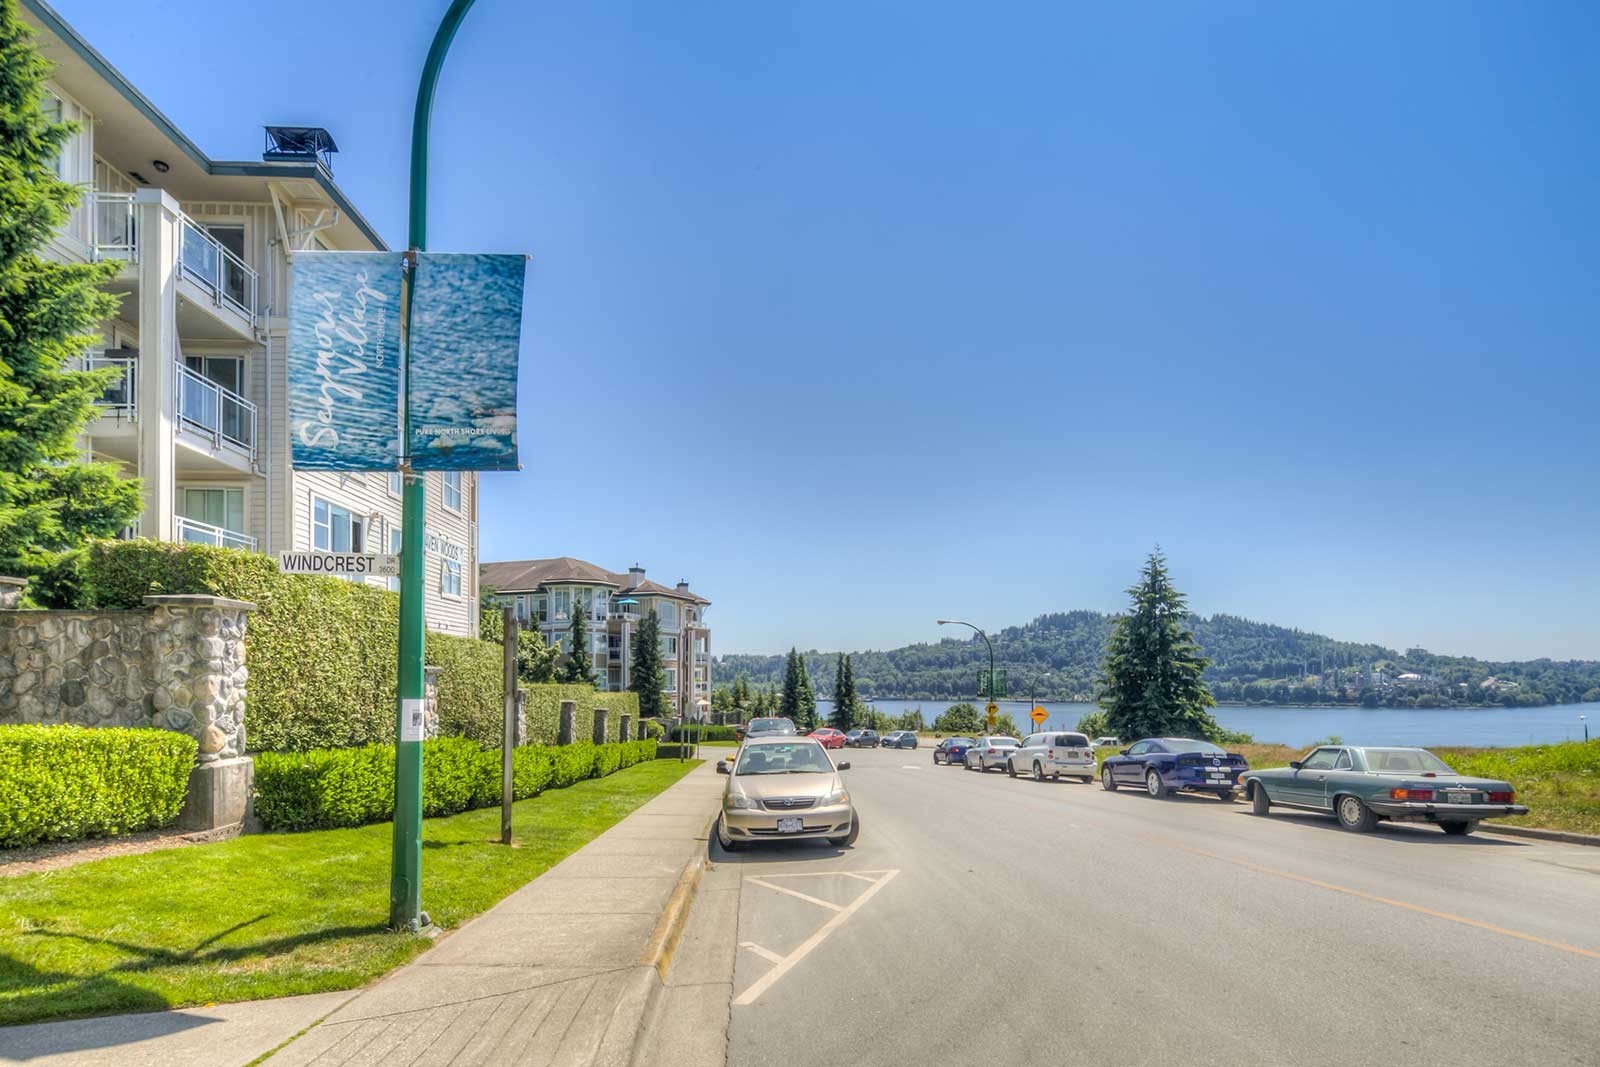
Living in North Vancouver City tends to appeal to renters who want a comfortable, day-to-day rhythm with the flexibility to choose a setting that matches their priorities. The community character can vary from calmer residential streets to more active pockets where daily errands and local services may be closer at hand. Many residents value the ability to balance home life with commuting needs, school routines, and weekend plans without feeling overly disconnected from surrounding hubs.
Walkability and convenience often depend on the specific pocket of the area, which is why exploring different sections of North Vancouver City matters. Some renters prefer a setting where a short trip connects them to essentials, while others prioritize a quieter environment and are happy to drive a bit more for shopping or recreation. Regardless of preference, the overall appeal commonly comes down to a sense of stability, a neighbourly atmosphere, and the ability to find a home that fits both budget and lifestyle.
From a housing perspective, houses can offer a variety of layouts that suit different life stages—whether someone is searching for a smaller footprint with simpler upkeep or a larger home with room for family, guests, or a dedicated workspace. For renters comparing multiple neighbourhoods, North Vancouver City can be an option worth considering for its mix of choices and the opportunity to find a rental that feels practical now and adaptable later.
5) Market Trends
To understand how the market is shifting over time, the table below summarizes key trends and comparisons for houses for rent in North Vancouver City.
Market Trends
Period Avg. Price Listings Avg. DOM Current $3,995 28 62 days Last 12 Months $3,502 87 40 days Last 90 Days $3,401 60 116 days 6) Top Areas
Exploring sub-areas within North Vancouver City can help renters pinpoint the right fit, since pricing, home styles, and day-to-day convenience can vary from one pocket to another.
Top Areas
Area Avg. Price Listings Avg. DOM Central Lonsdale $3,767 11 48 days Marine | Hamilton $4,567 8 43 days Lower Lonsdale $3,593 5 150 days Moodyville $2,992 3 39 days Grand Boulevard $6,950 1 8 days 7) Frequently Asked Questions
What is the average price of houses for rent in North Vancouver City?
The average listing price for houses for rent in North Vancouver City is currently $3,995. This figure is a useful benchmark, but actual pricing can vary based on home size, layout, condition, and which part of the area the property is located in.
How many houses for rent are available in North Vancouver City right now?
There are 28 active listings available, which provides renters with a range of choices to compare. Inventory levels can change quickly, so checking new listings and revisiting favourites regularly is helpful—especially when a home matches key needs such as bedroom count, space, or commute preferences.
How long do rentals typically stay on the market in North Vancouver City?
On average, listings spend 62 days on the market. Days on market can vary depending on pricing, property condition, and how closely a home aligns with current renter demand. When the market is moving faster, being prepared with documentation and a clear shortlist can help reduce delays in the application process.
What should renters compare besides monthly price when viewing houses for rent?
Beyond the listing price, it helps to compare usable space (905 sqft as a general reference), the layout’s functionality, and value indicators like $4. Renters may also want to consider practical factors such as storage, parking, outdoor space, and how well the home supports daily routines. Looking at -31.1% can also provide context on whether pricing has been trending upward or downward recently.
There are a lot of great restaurants. If you can't start your day without caffeine fear not, your nearby choices include Pegstets Coffee Shop. Groceries can be found at Mountain Top Wheat-Gluten-Free which is nearby and you'll find Bayview Lonsdale Dentist nearby as well. For nearby green space, Park could be good to get out of your home and catch some fresh air or to take your dog for a walk.
Transit riders take note, you are nearby to the closest Bus Stop (Northbound Lonsdale Ave @ E 8th St) with route Lynn Valley/lonsdale Quay, route Upper Lonsdale/lonsdale Quay, and more.